Cellular Respiration and Photosynthesis Venn Diagram: A Complete Guide
Plants, algae, bacteria, and animals all rely on two fundamental biochemical pathways—photosynthesis and cellular respiration. Though they appear to work in opposite directions, the two processes form a continuous cycle that powers life on Earth. A Venn diagram is an excellent visual tool for comparing and contrasting these pathways, helping students and educators see at a glance where they overlap and where they diverge. This article explains the key components of each process, outlines how to construct an effective Venn diagram, and highlights the aerobic respiration steps that often cause confusion.
What Is Photosynthesis?
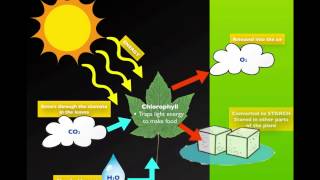
Photosynthesis is the process by which photo‑autotrophic organisms capture solar energy and store it in the chemical bonds of glucose. The reaction takes place in the chloroplasts of plant cells (or in analogous structures of cyanobacteria) and can be summarized by the equation:
6 CO₂ + 6 H₂O + light energy → C₆H₁₂O₆ + 6 O₂
Key stages include:
- Light‑dependent reactions: Photon absorption by chlorophyll drives water splitting (photolysis) and generates ATP and NADPH.
- Calvin‑Benson cycle: ATP and NADPH power the fixation of carbon dioxide into triose phosphates, which are later converted to glucose.
What Is Cellular Respiration?
Cellular respiration is the set of metabolic pathways that break down organic molecules—primarily glucose—to release energy stored as ATP. The overall aerobic reaction is the reverse of photosynthesis:
C₆H₁₂O₆ + 6 O₂ → 6 CO₂ + 6 H₂O + ≈ 30‑32 ATP
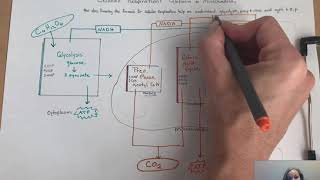
In eukaryotes, respiration occurs mainly in the mitochondria and proceeds through three major stages:
- Glycolysis (cytosol): One glucose molecule is split into two pyruvate molecules, yielding 2 ATP and 2 NADH.
- Citric‑acid cycle (Krebs cycle) (mitochondrial matrix): Each pyruvate is converted to acetyl‑CoA, which then cycles to produce additional NADH, FADH₂, and a small amount of ATP.
- Oxidative phosphorylation (inner mitochondrial membrane): Electrons from NADH and FADH₂ travel through the electron‑transport chain, creating a proton gradient that drives ATP synthase.
Why a Venn Diagram?
Both processes involve the exchange of gases, the flow of electrons, and the transformation of energy, yet they differ in location, inputs, and outputs. A Venn diagram with two overlapping circles lets you place shared features in the middle and unique attributes in the outer sections, making the comparison instantly clear.
How to Build the Diagram
Follow these steps to create a clear, educational Venn diagram:
- Draw two circles of equal size so they intersect.
- Label the left circle “Photosynthesis” and the right circle “Cellular Respiration.”
- Populate the left‑only area with items such as “Occurs in chloroplasts,” “Uses light energy,” “Produces O₂,” and “Fixes CO₂.”
- Populate the right‑only area with items such as “Occurs in mitochondria,” “Uses O₂,” “Produces CO₂ and H₂O,” and “Generates ATP.”
- Fill the overlapping region with shared concepts: “Involves electron transport chains,” “Transforms energy,” “Uses ADP/ATP,” and “Occurs in all eukaryotic cells.”
- Add visual cues—different colors for each circle, icons for light, O₂, CO₂, and ATP—to aid memory retention.
Key Overlapping Features
- Energy conversion: Both convert energy from one form to another (light → chemical; chemical → usable ATP).
- Electron carriers: NAD⁺/NADH and NADP⁺/NADPH shuttle electrons in both pathways.
- Carbon flow: Carbon atoms move from CO₂ to glucose in photosynthesis and back to CO₂ in respiration.
- Enzyme regulation: Both are tightly regulated by feedback mechanisms that balance cellular needs.
Distinctive Elements of Each Process
Photosynthesis (left‑only)
- Requires photons and chlorophyll pigments.
- Occurs in thylakoid membranes of chloroplasts.
- Produces oxygen as a by‑product.
- Stores energy in the form of glucose and other carbohydrates.
Cellular Respiration (right‑only)
- Requires molecular oxygen as the final electron acceptor.
- Occurs in the inner mitochondrial membrane and matrix.
- Releases carbon dioxide and water as waste.
- Provides immediate energy for cellular work via ATP.
Exploring Aerobic Respiration in Detail
The term “aerobic” simply means “with oxygen.” In the presence of O₂, the electron‑transport chain can operate at maximum efficiency, producing up to 32 ATP per glucose molecule. If oxygen is scarce, cells switch to anaerobic pathways (fermentation), which yield far less ATP and generate different end products such as ethanol or lactate. Highlighting aerobic respiration in the Venn diagram emphasizes its reliance on the O₂ generated by photosynthesis—a perfect illustration of nature’s circular economy.
Real‑World Applications of the Diagram
Educators use the Venn diagram to:
- Introduce middle‑school students to the concept of energy flow in ecosystems.
- Help high‑school biology classes compare metabolic pathways before a lab on leaf disc photosynthesis.
- Support college‑level biochemistry courses when discussing the coupling of light reactions with oxidative phosphorylation.
Scientists also reference the diagram when modeling carbon cycling in climate‑change research, because the balance between photosynthetic CO₂ uptake and respiratory CO₂ release determines atmospheric carbon levels.
Summary of the Relationship
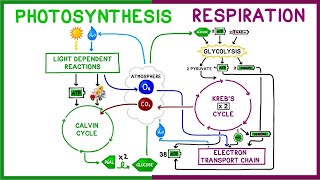
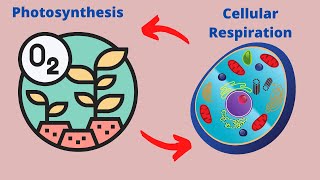
Photosynthesis and cellular respiration are two sides of the same biochemical coin. Photosynthesis captures solar energy and stores it as glucose, while respiration extracts that stored energy to power cellular activities. The Venn diagram captures this relationship by placing shared mechanisms—electron transport, ATP turnover, and carbon exchange—in the overlap, while keeping the unique locations, inputs, and outputs separate.
Key Takeaways
- Both processes are essential for life; one cannot function without the other.
- A well‑designed Venn diagram clarifies similarities (energy conversion, electron carriers) and differences (site, reactants, products).
- Aerobic respiration depends on the oxygen produced by photosynthesis, completing the global energy loop.
- Understanding the diagram equips students to grasp larger concepts such as ecosystem productivity and climate dynamics.
Final Thought
When you look at a leaf or take a breath, you are witnessing the outcome of a seamless partnership between photosynthesis and cellular respiration. By visualizing this partnership with a Venn diagram, you not only memorize facts—you also appreciate the elegant choreography that keeps our planet alive.