Enzyme Graphing Worksheet: A Practical Guide for A-Level Students
When studying enzymes in Biology or Chemistry, one of the most effective ways to understand their kinetics is by creating and interpreting graphs. An enzyme graphing worksheet provides a structured approach to visualise how enzymes interact with substrates, how inhibitors affect activity, and how temperature or pH changes influence reaction rates. This article outlines a detailed, step‑by‑step method for building such worksheets and offers tips to help A-Level students achieve a solid grasp of enzyme mechanics.
Why Graphs Matter in Enzyme Studies
Enzymes are biological catalysts that speed up chemical reactions. Their behaviour can be described by mathematical relationships, most famously the Michaelis–Menten equation. Graphs transform complex data into visual patterns, making it easier to:
- Identify key parameters like Vmax and Km.
- Compare the effects of different inhibitors or activators.
- Predict reaction rates under varying conditions.
- Communicate results clearly in exam answers or laboratory reports.
Because examiners expect students to both draw and interpret enzyme graphs, mastering this skill can contribute significantly to a high A-Level grade.
Components of a Standard Enzyme Graphing Worksheet
A well‑structured worksheet typically contains the following sections:
- Data Table – Raw measurements of substrate concentration and reaction velocity.
- Plotting Area – A blank graph with axes labeled for substrate concentration (S) and velocity (v).
- Analysis Questions – Prompts that guide students to calculate Vmax and Km, identify inhibition type, and discuss temperature or pH effects.
- Reflection Box – Space for students to note any trends or anomalies and propose explanations.
Below is an example of a simple worksheet layout that you can adapt for practice or revision.
Example Worksheet: Lactase Activity vs. Substrate Concentration
Scenario: A student measures the rate of lactose hydrolysis by lactase at various lactose concentrations. The following table provides the experimental data.
Data Table
Substrate (mM)Velocity (µmol min-1) 0.10.8 0.53.2 1.05.5 2.58.9 5.010.1 10.0


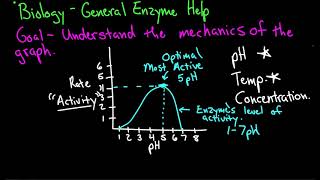


![Enzyme Kinetics with Michaelis-Menten Curve | V, [s], Vmax, and Km Relationships](https://i.ytimg.com/vi/kmyR1cYxRL4/mqdefault.jpg)


