Introduction to Independent and Dependent Variables
When working with graphs, it's essential to understand the concept of independent and dependent variables. In this article, we'll delve into the world of variables and explore how to identify them on a graph. Whether you're a student or a mathematician, this knowledge will help you better analyze and interpret data.
What are Independent and Dependent Variables?
In a scientific experiment or study, variables are the factors that can be changed or controlled. The independent variable is the factor that is intentionally changed or manipulated by the researcher to observe its effect on the dependent variable. On the other hand, the dependent variable is the factor being measured or observed in response to the independent variable.
For example, if we're studying the effect of light on plant growth, the independent variable would be the amount of light provided, and the dependent variable would be the growth of the plant. By changing the amount of light, we can observe how it affects the plant's growth.
Identifying Independent and Dependent Variables on a Graph
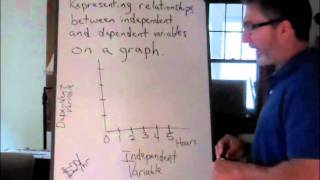
When looking at a graph, it's crucial to identify which variable is independent and which is dependent. The independent variable is usually plotted on the x-axis, while the dependent variable is plotted on the y-axis. This is because the independent variable is the factor being controlled, and the dependent variable is the factor being measured.
To determine the independent and dependent variables on a graph, follow these steps:
- Look at the x-axis and identify the variable being plotted. This is usually the independent variable.
- Look at the y-axis and identify the variable being plotted. This is usually the dependent variable.
- Consider the context of the graph and the relationship between the variables. Ask yourself, "Which variable is being manipulated, and which variable is being measured?"
By following these steps, you can easily identify the independent and dependent variables on a graph.
Examples of Independent and Dependent Variables
Let's consider a few examples to illustrate the concept of independent and dependent variables:
- Example 1: A study on the effect of temperature on the solubility of a substance. In this case, the independent variable is the temperature, and the dependent variable is the solubility of the substance.
- Example 2: An experiment on the effect of exercise on heart rate. Here, the independent variable is the amount of exercise, and the dependent variable is the heart rate.
- Example 3: A graph showing the relationship between the amount of fertilizer used and the growth of a plant. In this example, the independent variable is the amount of fertilizer, and the dependent variable is the growth of the plant.
These examples demonstrate how independent and dependent variables work together to help us understand the relationships between different factors.
Why are Independent and Dependent Variables Important?
Understanding independent and dependent variables is crucial in various fields, including science, mathematics, and engineering. By identifying these variables, researchers can:
- Analyze data and draw conclusions about the relationships between variables.
- Make predictions and forecasts based on the data.
- Design experiments and studies to test hypotheses and answer questions.
In addition, recognizing independent and dependent variables helps to avoid confusion and misinterpretation of data. It's essential to clearly define and identify these variables to ensure accurate and reliable results.
Tips for Working with Independent and Dependent Variables
When working with independent and dependent variables, keep the following tips in mind:
- Clearly define the variables: Make sure you understand what each variable represents and how they relate to each other.
- Label the axes: When creating a graph, label the x-axis and y-axis with the corresponding variables.
- Consider the context: Think about the relationship between the variables and the context in which they are being studied.