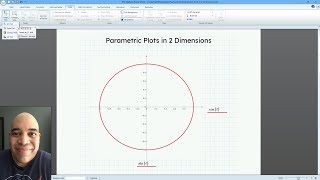
Getting Started with Mathcad Prime Plot
Mathcad Prime Plot is a versatile tool for visualizing data, equations, and multi‑domain functions directly within the Mathcad environment. Whether you need a simple XY chart to track experimental results or a complex 3‑D surface to explore design parameters, Mathcad Prime provides an intuitive workflow that integrates seamlessly with PTC’s engineering suite.
Why Use Mathcad Prime for Plotting?
Engineers and scientists choose Mathcad Prime because it combines symbolic computation with high‑quality graphics. The plotting engine supports:
- Dynamic XY plots that update automatically when underlying data changes.
- 3‑D visualizations for surfaces, contours, and parametric curves.
- Multi‑domain functions that allow you to define piecewise behavior across different variable ranges.
- Full integration with PTC tools, enabling a smooth transition from analysis to design.
Creating a Basic XY Plot
Follow these three steps to generate a clear, publication‑ready XY chart:
- Enter your data. In a worksheet, create two vectors—one for the independent variable (X) and one for the dependent variable (Y). For example:
- X := 0, 1, 2, 3, 4, 5
- Y := 0, 2, 4, 6, 8, 10
- Insert the plot. Click the Insert tab, choose XY Plot, and select the X and Y vectors. Mathcad Prime automatically draws the points and connects them with a line.
- Customize appearance. Use the property pane to adjust markers, line style, axis labels, and grid lines. Adding a title such as “Linear Relationship Between X and Y” improves readability.
When the data vectors are edited, the plot refreshes instantly, ensuring that your visual representation always reflects the latest calculations.
Visualizing Functions with X‑Y Plots
Beyond raw data, Mathcad Prime can plot analytical functions. For instance, to display a sine wave:
- Define a range: t := 0, 0.1..6.28.
- Compute the function: f(t) := sin(t).
- Insert an XY plot using t as the X axis and f(t) as the Y axis.
The resulting curve shows the smooth periodic behavior of the sine function. Adding a second function, such as g(t) := 0.5·sin(2t), allows you to compare multiple series on the same axes.
Building 3‑D Plots for Design Insight
Mathcad Prime also supports three‑dimensional graphics, which are valuable when exploring design