Understanding the Place Value Chart To The Billions
Welcome, young mathematicians! Today, we are diving into the exciting world of place value and exploring how a Place Value Chart To The Billions helps students in grades 3‑5 make sense of large numbers. This article breaks down the concept, shows the relationship between each digit, and offers practical classroom ideas for teachers who want to bring Numberock’s fun resources into their lessons.
Why a Place Value Chart Matters
In elementary school, students first encounter the idea that the position of a digit determines its value. A place value chart visualizes this rule, turning abstract numbers into concrete blocks that can be counted, compared, and manipulated. When the chart extends to the billions, learners can see how a single digit in the billions column outweighs all the digits to its right.
Components of a Billions Place Value Chart
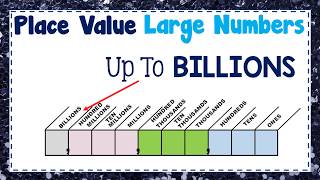
A typical Place Value Chart To The Billions includes the following columns, from left to right:
- Billions
- Hundred‑Millions
- Ten‑Millions
- Millions
- Hundred‑Thousands
- Ten‑Thousands
- Thousands
- Hundreds
- Tens
- Ones
Each column represents a power of ten, and the chart can be printed on a poster, displayed on a smartboard, or built with manipulatives such as base‑ten blocks.
What Is the Relationship Between Digits?
The relationship between digits is simple yet powerful: moving one place to the left multiplies a digit’s value by ten, while moving one place to the right divides it by ten. For example, in the number 4,372,819,205:
- The digit 4 in the billions column equals 4 × 1,000,000,000.
- The digit 3 in the hundred‑millions column equals 3 × 100,000,000.
- Each subsequent digit follows the same pattern.
Understanding this relationship helps students compare numbers, round to the nearest million or billion, and solve word problems that involve large quantities.
How to Introduce the Chart in the Classroom
Here are three steps teachers can follow to make the Place Value Chart To The Billions an engaging part of their math routine:
- Start with a story. Use a real‑world scenario—such as the population of a country or the distance to a distant planet—to show why billions matter.
- Build the chart together. Have students place labeled cards for each column on a wall or whiteboard, reinforcing the order of magnitude.
- Practice with manipulatives. Provide base‑ten blocks or digital tiles that students can move into the appropriate column to represent a given number.
Fun Activities to Reinforce Billions Place Value
These activities align with Numberock’s equally fun teaching resources, which are available for a free month of access for 3rd and 4th grade teachers.
- Billions Bingo. Create bingo cards with numbers that include billions. Call out clues like “The digit in the billions place is 7” and let students cover the matching number.
- Roll‑and‑Write Challenge. Students roll a ten‑sided die for each column, building a random number up to the billions place, then write it in standard form.
- Place Value Relay. In teams, students race to place digit cards into the correct column on a large floor chart. The fastest correct team earns points.
Connecting to Earlier Lessons
This video is a continuation of the videos about basic place value and the thousands chart. By extending the same visual language to billions, learners see a natural progression: ones → tens → hundreds → thousands → … → billions. The continuity helps solidify the concept that each step up is simply “ten times bigger.”
Tips for Teachers Using Numberock Resources
Numberock offers animated lessons that pair perfectly with a Place Value Chart To The Billions. Here are a few tips to maximize their impact:
- Preview the video. Watch the clip first to note key vocabulary such as “digit,” “place value,” and “relationship.”
- Pause for discussion. After each segment, ask students to identify the digit in a specific column of a sample number.
- Integrate assessment. Use quick exit tickets where students write the value of a digit in the billions place, reinforcing mastery.
Why Mastering Billions Is Important
Even though most everyday numbers are smaller than a billion, exposure to large numbers prepares students for future topics like scientific notation, data analysis, and financial literacy. Understanding the Place Value Chart To The Billions builds a strong foundation for middle‑school math and beyond.
Conclusion
Learning place value is a cornerstone of mathematical fluency. By using a clear, colorful Place Value Chart To The Billions, teachers can turn intimidating numbers into manageable pieces. Combine the chart with engaging stories, hands‑on manipulatives, and Numberock’s video lessons, and students in grades 3‑5 will confidently navigate the world of billions and beyond.