Mastering Tableau Table Calculations: A Practical Guide
Tableau is renowned for turning raw data into interactive visual stories. One of its most powerful features is table calculations, which allow you to perform computations directly on the visualized data. Whether you’re a beginner or an experienced analyst, understanding table calculations can elevate your dashboards to new levels of insight.
What Are Table Calculations?
Table calculations are dynamic formulas applied to the results of a visual query. They operate on the rows or columns that Tableau renders, not on the underlying data source. This means you can create running totals, moving averages, percent-of-total, and more without altering your data model.
- Running Total – Cumulative sum across a dimension.
- Moving Average – Average over a sliding window.
- Percent of Total – Share of a grand total.
- Difference From – Change between successive values.
Because they’re calculated on the fly, table calculations are ideal for exploratory analysis and quick visual adjustments.
Why Table Calculations Matter in Tableau
Using table calculations offers several advantages:
- Speed – Calculations happen at render time, so you don’t need to pre‑aggregate data.
- Flexibility – Change a calculation by editing a single line of code.
- Consistency – Reuse the same calculation across multiple sheets.
- Transparency – Tableau’s “Show Calculation” feature reveals the underlying formula.
These benefits make table calculations a cornerstone of efficient Tableau workflows.
Step‑by‑Step: Creating Your First Table Calculation
Follow this walkthrough to add a simple running total to a sales dashboard:
- Drag a Measure – Place Sales onto the Rows shelf.
- Add a Dimension – Drag Order Date to Columns.
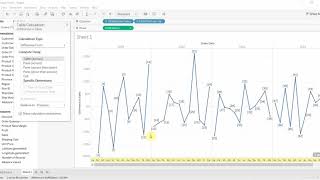
- Right‑Click the Measure – Select Add Table Calculation.
- Choose Calculation Type – Pick Running Total from the list.
- Set Direction – Ensure it’s set to Table Across for a cumulative sum by date.
- Apply – Click OK to see the running total chart.
Tableau automatically updates the calculation when you filter or sort the data, keeping your visualizations accurate.
Common Pitfalls and How to Avoid Them
While table calculations are powerful, they can be tricky. Keep these tips in mind:
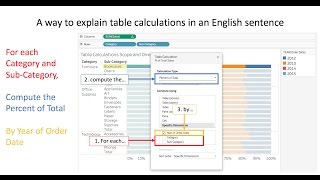
- Scope and Direction – Misconfigured scope can produce unexpected results. Double‑check the Compute Using setting.
- Null Handling – Null values may break a running total. Use ZN() to replace nulls with zero